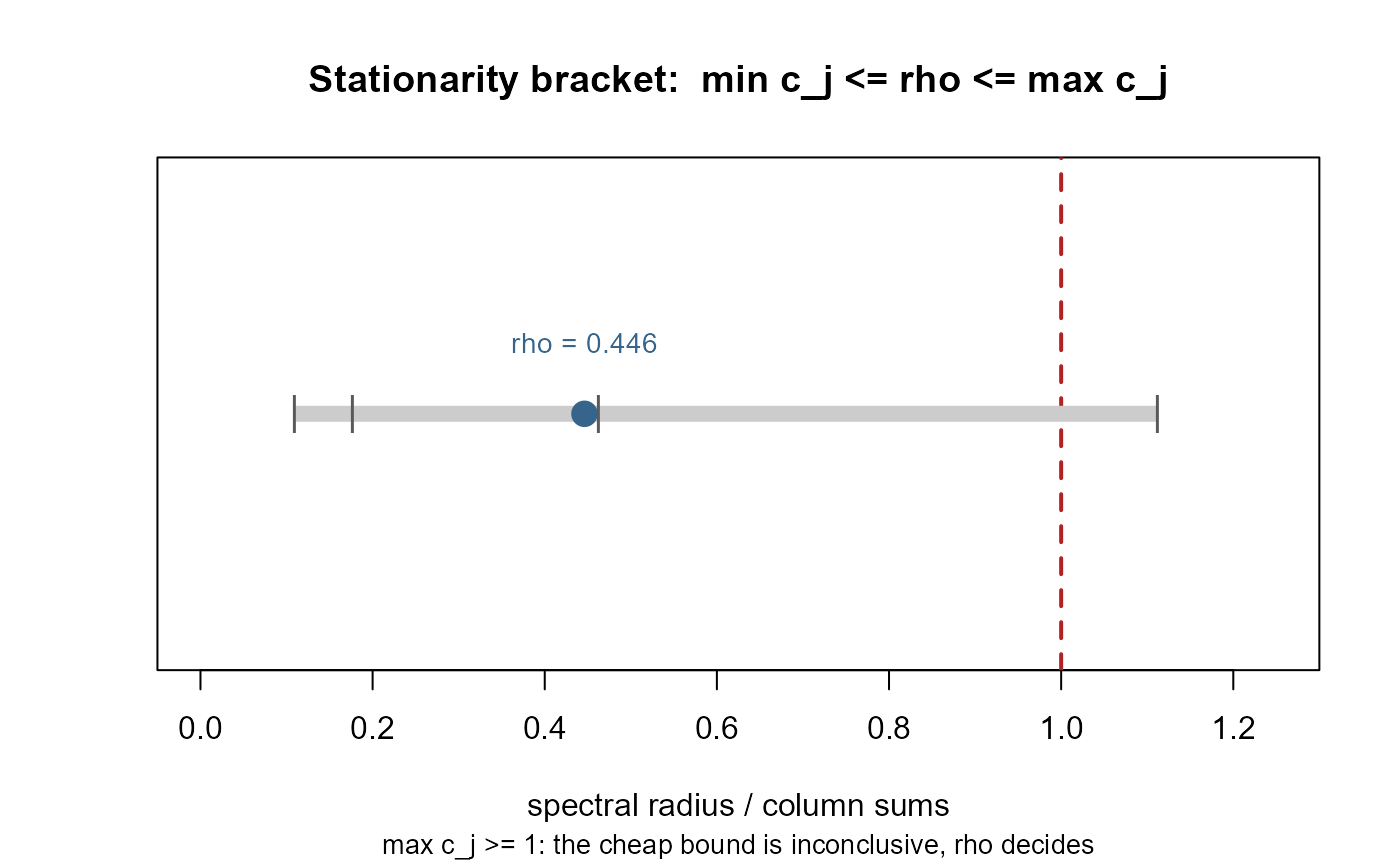
Plot the stationarity bracket of an NMF-VAR model
Source:R/nmfkc.ar.R
plot.nmfkc.ar.stationarity.RdDraws the Perron-Frobenius bracket \(\min_j c_j\le\rho(\sum_d
G_d)\le\max_j c_j\) against the unit boundary, where \(c_j\) are the column
sums of \(\sum_d\Theta_d\). It shows at a glance whether the cheap
sufficient condition settles stationarity or an eigenvalue computation is
needed. For the model's dynamics see plot.nmfkc.ar.latent.
Usage
# S3 method for class 'nmfkc.ar.stationarity'
plot(x, ...)
Arguments
- x
An object from
nmfkc.ar.stationarity.- ...
Passed to the underlying plot call.