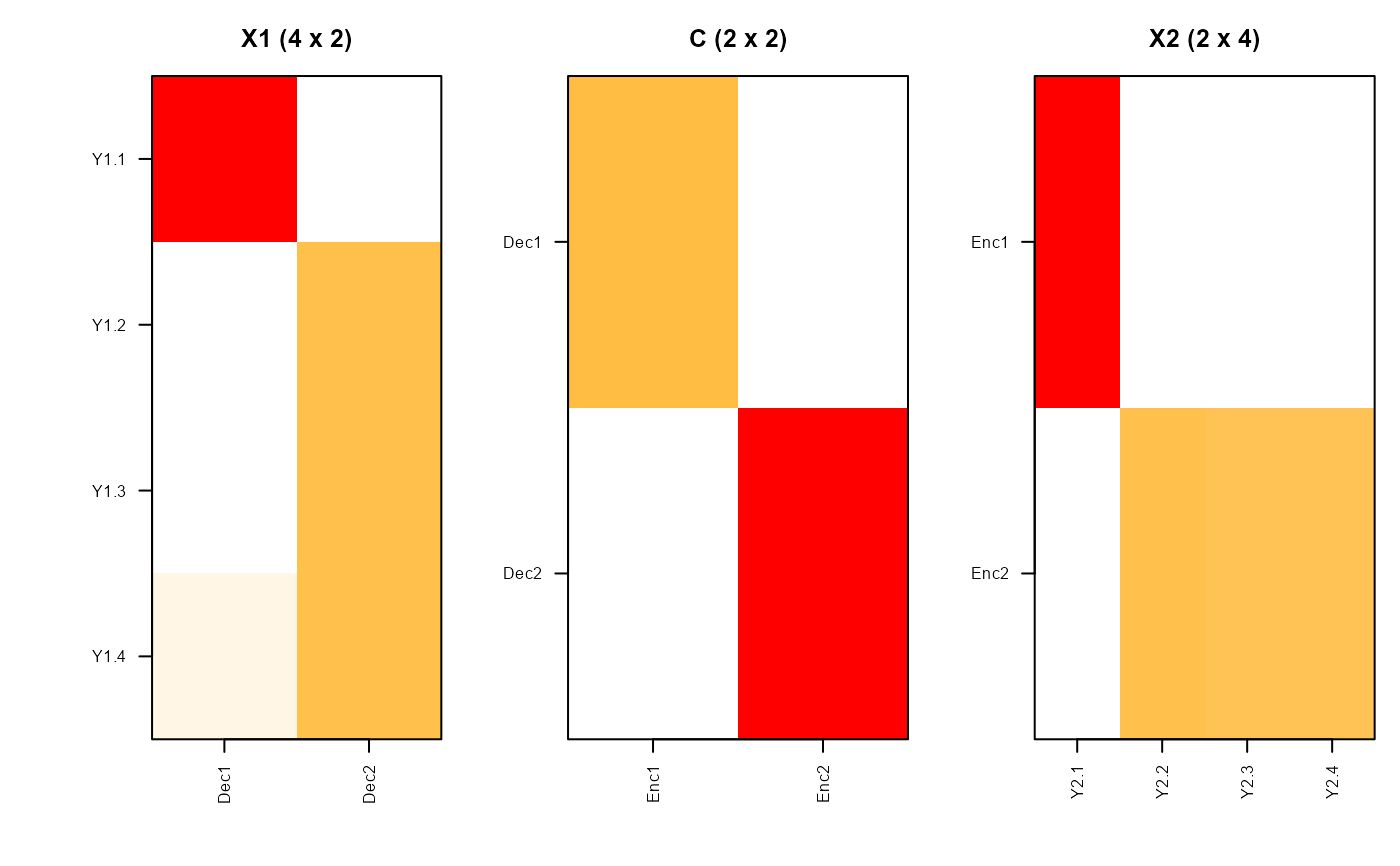
nmfae.heatmap displays the three factor matrices \(X_1\), \(\Theta\),
and \(X_2\) as side-by-side heatmaps. This provides an alternative to DOT graph
visualization, especially when \(Y_2\) has many variables (e.g., kernel matrix).
Usage
nmfae.heatmap(
  x,
  Y1.label = NULL,
  X1.label = NULL,
  X2.label = NULL,
  Y2.label = NULL,
  palette = NULL,
  ...
)
Arguments
- x
An object of class
"nmfae"returned bynmfae.- Y1.label
Character vector of output variable names (rows of \(X_1\)).
- X1.label
Character vector of decoder basis labels (columns of \(X_1\)).
- X2.label
Character vector of encoder basis labels (rows of \(X_2\)).
- Y2.label
Character vector of input variable names (columns of \(X_2\)).
- palette
Color palette vector. Default is white-orange-red (64 colors).
- ...
Not used.
Lifecycle
This function is experimental. The interface may change in future versions; details are to be described in an upcoming paper.