nolap() spreads overlapping points of a scatter plot into distinct
rectangular cells so that no two points share a cell, while keeping the total
movement of the points small. The plotting area is divided into an
xdiv by ydiv grid; whenever several points fall in the same
cell they are relocated, one at a time, each to its nearest empty cell.
Arguments
- x
numeric vector of x-coordinates.
- y
numeric vector of y-coordinates (the same length as
x).- xdiv
number of divisions along the x-axis (a positive integer).
- ydiv
number of divisions along the y-axis (a positive integer).
xdiv * ydivmust be at leastlength(x).- xlim
length-2 numeric giving the x-range to be divided (default
range(x)).- ylim
length-2 numeric giving the y-range to be divided (default
range(y)).- seed
optional integer. If supplied, the random restarts are skipped and this single seed is used, giving a reproducible layout.
- nseed
number of random restarts tried when
seedisNULL; the layout with the smallestssdis kept.
Value
A list with the elements:
- xleft, ybottom, xright, ytop
numeric vectors giving, for each point, the left, bottom, right and top edges of the cell it was placed in (convenient for
rect).- x, y
numeric vectors of the cell-centre coordinates of the placed points.
- xlims, ylims
two-column matrices of the x- and y-axis cell boundaries.
- is.moved
logical vector;
TRUEwhere a point was moved out of its original cell.- ssd
total distance moved, measured in grid cells (the sum of the Euclidean distances between the original and final cells).
- seed
the seed used: the supplied
seed, or the best seed found among the random restarts.
Details
The procedure is:
The area given by
xlimandylimis split intoxdiv * ydivequal rectangular cells and every point is assigned to the cell that contains it.While some cell still holds more than one point, the most crowded cell is selected and one of its points is moved to the nearest currently empty cell (ties are broken at random).
Because every move fills exactly one empty cell, the number of surplus points strictly decreases, so the algorithm always stops after at most
length(x)moves and returns a layout in which every point occupies its own cell (no overlap).
Moving each point to its nearest empty cell keeps it close to its
original position. When seed is NULL, nseed independent
random restarts are tried and the layout with the smallest total movement
(ssd) is returned, together with the seed that produced it; supplying
seed instead uses that single seed and gives a reproducible layout.
The function does not disturb R's random number generator: the value of
.Random.seed is saved on entry and restored on exit.
Note
ssd is expressed in grid-cell units, not in the units of x and
y. Points that lie outside xlim or ylim are placed in
the nearest edge cell and a warning is issued. If x or y has a
zero-width range (for example, every value is identical) the corresponding
limits are widened slightly so that the grid remains well defined.
Examples
x <- cars$speed
y <- cars$dist
res <- nolap(x = x, y = y, xdiv = 10, ydiv = 10, nseed = 10)
print(res$seed)
#> [1] 2
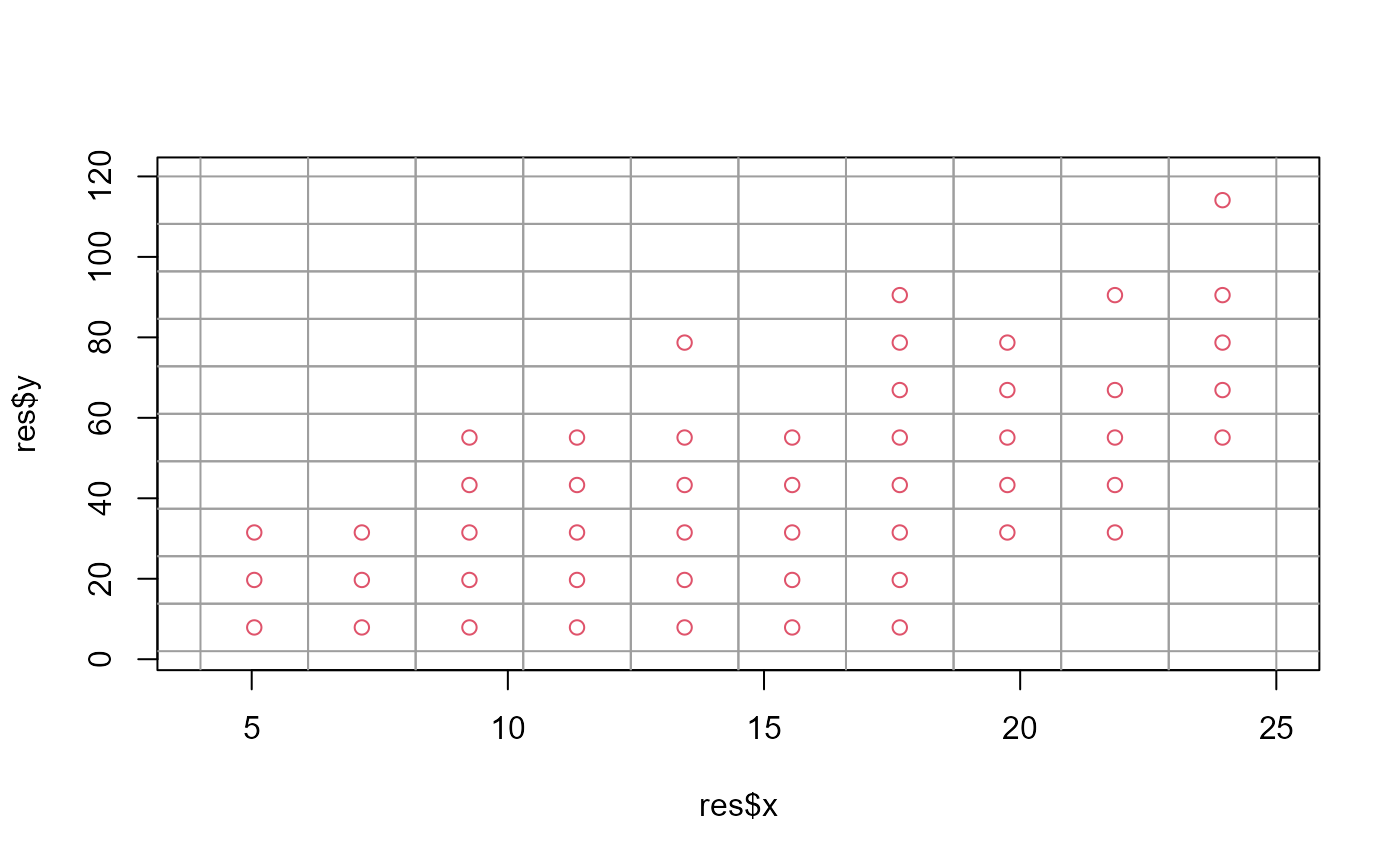
# the spread-out (non-overlapping) points
plot(res$x, res$y, col = 2,
xlim = range(res$xlims), ylim = range(res$ylims))
abline(h = res$ylims, col = 8)
abline(v = res$xlims, col = 8)
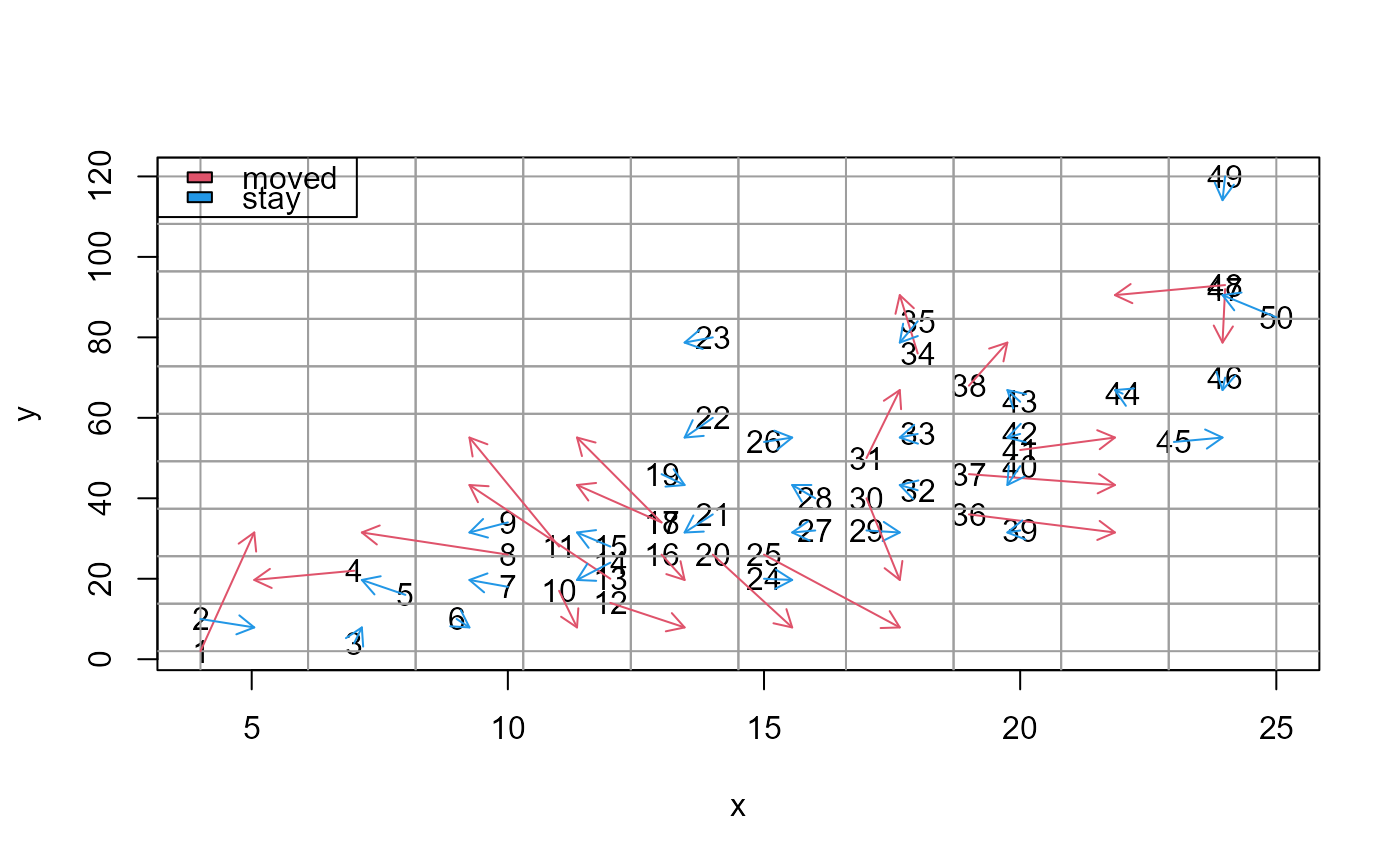
 # how the points were moved
plot(x, y, xlim = range(res$xlims), ylim = range(res$ylims), type = "n")
text(x, y, seq_along(x))
abline(h = res$ylims, col = 8)
abline(v = res$xlims, col = 8)
arrows(x, y, res$x, res$y, length = 0.1,
col = ifelse(res$is.moved, 2, 4))
legend("topleft", legend = c("moved", "stay"), fill = c(2, 4))
# how the points were moved
plot(x, y, xlim = range(res$xlims), ylim = range(res$ylims), type = "n")
text(x, y, seq_along(x))
abline(h = res$ylims, col = 8)
abline(v = res$xlims, col = 8)
arrows(x, y, res$x, res$y, length = 0.1,
col = ifelse(res$is.moved, 2, 4))
legend("topleft", legend = c("moved", "stay"), fill = c(2, 4))